It is not practical to measure the effectiveness of individual controls and then combine the results

Effectiveness
Understanding the effectiveness of an organisation’s system of internal control is important because it allows the organisation to fine tune its sprites and controls. There are two categories of effectiveness: operational effectiveness and cost effectiveness
Operational effectiveness
Sprites
There are seven classes of sprite, which form a spectrum of controls, as shown in the following table:
|
The spectrum is ordered on the speed by which the sprite detects the opportunity and its ability to successfully exploit it. Once exploitation is possible, it is ordered on its success rate of harvesting the benefit. Note that sprites work in pairs or triples. The most successful combination is for a creative sprite to create the opportunity, which then exploited by a class 2 and harvested by a class 5. A exploitation sprite may degrade to a lower class (higher class number) under operational stress, for example, if too many invitations to tender arrive at the same time, then an organisation might not have the resources to cope. Unlike controls, harvest sprites do not act as a backup to the failure of exploitation sprites - an organisation would require a risk treatment plan to deal with that scenario.
A creative sprite is more operationally effective than another creative sprite if it is more capable of creating better opportunities more often. That means the potential reward (FoL * Val) is greater. An exploitation sprite is more operationally effective than another exploitation sprite if its ability to increase the FoL of the benefit is greater. Likewise a harvest sprite is more operationally effective than another harvest sprite if its ability to increase the value of the benefit is greater.
Controls
There are also seven classes of control, which form a spectrum of controls, as shown in the following table:
|
The spectrum is ordered on the speed by which the control detects the event and its ability to prevent the consequence. If it fails to prevent the consequence it is ordered on the speed of recovery. A detective control that falls into one class may degrade to a lower class (higher class number) under operational stress. For example, as the frequency of events is increased, a class 2 control will degrade towards class 3. Eventually, as the frequency of events is increased still further it will be overwhelmed and become a class 4. It will not degrade further as it is still a detective control and as such has no recovery properties. Note that controls operate in sequence to form a defensive shield. A class 5 control should be used to back up a class 2 control in case that fails, for example under operational stress, or because the actual event is subtly different from the one that the class 2 control was actually designed to detect. The class 2 control in turn should be used to backup a class 1 control in case it fails to prevent the event.
A control is more operationally effective than another if the first is higher up in this spectrum of controls. However there is a more precise definition as in the case of sprites, and that is for preventive and detective controls, its ability to reduce the FoL of the consequence is greater. Likewise a reactive control is more operationally effective than another if the ability of the first to reduce the severity of the consequence is greater.
Determining residual risk
Controls are characterised by the ways in which they modify risk, i.e. the way in which they modify the frequency/likelihood of the occurrence of an consequence (FoL) or the severity of that consequence (sev) should it occur. However, in order to faithfully take account of how a control operates in practice, residual risk calculations need to be quite sophisticated. For example:
- A control may act to reduce FoL or Sev to zero or other limiting constant
- If a preventive control relies on some mechanism which would permit a 1 in N chance of being defeated, then it will reduce FoL by the factor N
- A detective control may lack the capacity to deal with multiple events. In this case, the control may be overwhelmed when the event FoL exceeds some threshold. Similarly a reactive control may be overwhelmed when the event FoL exceeds some threshold, or may otherwise have limited effect if the severity of the consequence that the control has to deal with exceeds some (other) threshold.
However, it is not practical to measure the effectiveness of individual controls and then combine the results, for example, using the above mentioned characteristics, in order to determine the effectiveness of a risk treatment plan. To do so would be akin to evaluating the performance of an army under attack by measuring the defensive strength of individual soldiers. Many measurements would have to be made and it might not be possible with any degree of certainly to take account of their interactions.
From the perspective of design a better strategy is to devise risk acceptance criteria that place conditions on the types of controls that are used (e.g. an appropriate mixture of preventive, detective and reactive controls). From the perspective of measuring performance a better strategy is to test the risk treatment plan, e.g. in the case of information security, through a variety of simulated attack scenarios, and for each one measure a variety of parameters, such as how much knowledge is required and how long does it take to defeat the controls. In this case, if a person without any technical knowledge of IT, understanding of the risk treatment plan, specialist equipment or inside help can defeat the risk treatment plan within minutes, then one might conclude that the risk treatment plan, at least with regards to some particular risk or group of related risks, is not very good. On the other hand, if the risk treatment plan can withstand a sophisticated attack mounted by experts with inside help over a period of months or years, then one might conclude that to all intents and purposes that aspect of the risk treatment plan is unbreakable.
Cost effectiveness

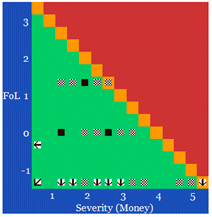
In the real world, we also need to take account of cost, and what might be the most operationally effective may not be the most cost effective. To determine cost effectiveness, the organisation must consider the cost of sprites and controls and in doing so the rewards and risks involved in terms of the FoL and value of the benefits and the FoL and severity of consequences. For example, these factors would be taken into account when deciding between two competing products, Product A which appears to offer greater reward but for increased risk, whilst Product B appears to offer lower reward but for lower risk. In the diagram (right) the off-scale values (indicated by the arrows) indicate the likelihood of over-control. The controls used to manage those risks may be relaxed, whilst still keeping the overall residual risk within the region of acceptability.
.jpg)

you consent to that site setting authentication session cookies

